Home » union organizing

Tag: union organizing

Union Election Requests

NLRB Continues to Process More Union Election Requests

In an April 7, 2023, press release, the National Labor Relations Board announced a slight increase in union election petitions for the first six months of its 2023 fiscal year. Digging deeper, however, the latest data may suggest more of an uptick in unionization than even the NLRB acknowledges. After stripping away the unprecedented number of Starbucks elections sought last year, the number of union election requests from October 2022 through March 2023 reveals a potentially much broader trend.

NLRB Press Releases

The NLRB’s recent press release focused more on unfair labor practice charge filings, which were up 16% during the first half of the current fiscal year. Unlike last year’s corresponding release, the reference to union election petitions was much more subdued. October – March FY ’23 saw 1,200 total representation cases filed, compared to 1,174 during the same period last year. That’s only a 2% increase.

In the first half of FY ’22, the NLRB reported a shocking 57% increase in representation case filings. As we discussed at the time, that statistic was skewed by two key factors: Starbucks and COVID-19. The NLRB’s numbers also aggregate all representation cases, not just those seeking to form a union in the first instance. Most notably, “representation cases” also include filings seeking to remove a union from a workplace. Such “decertification” filings were up 35% in the first half of FY ’22 compared to the corresponding months in FY ’21. (These “RD” cases are back down 13% in FY ’23.)

In some senses, it’s fair to say the NLRB oversold the increase in representation cases a year ago. Yes, it was dealing with more cases than in the previous year. But, Starbucks aside, that didn’t reflect an overall greater propensity to organize. Nonetheless, we may now be experiencing that reality.

Union Election Requests – RC Petitions

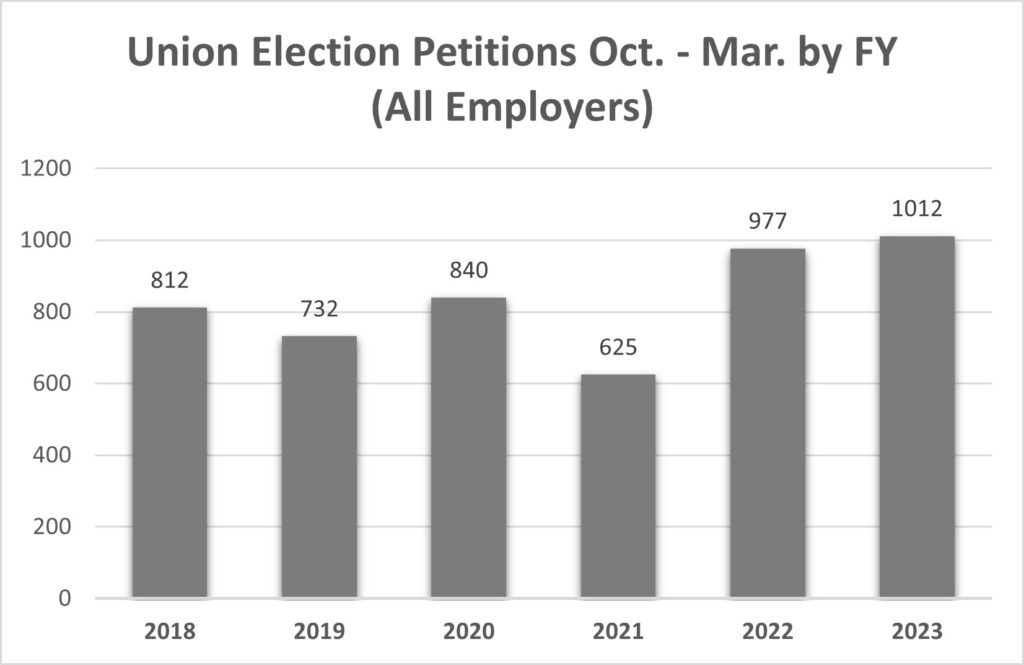
Overall, the National Labor Relations Board received 1,012 “RC” petitions seeking union representation between October 2022 and March 2023. That’s a 3.5% increase over the 977 petitions from the same period last year.

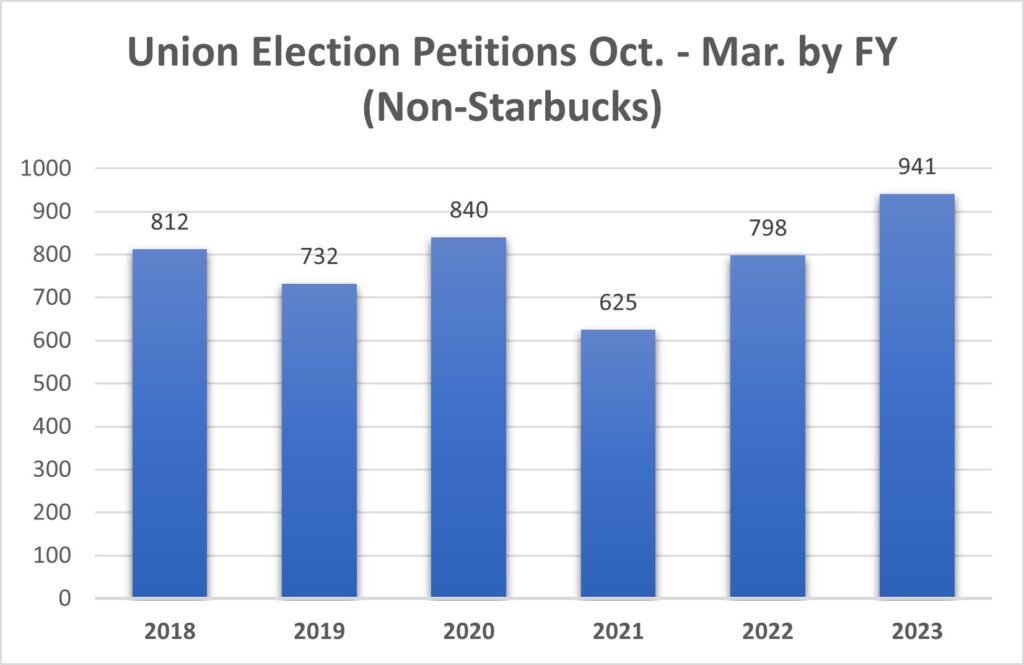
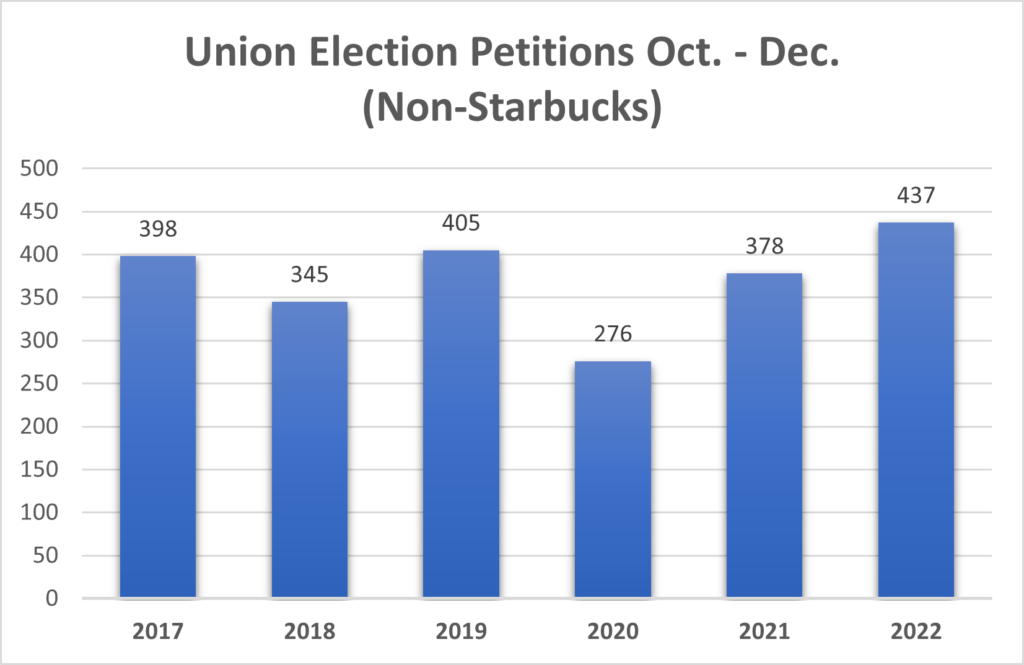
But, when you simply remove the Starbucks cases, the magnitude of the increase rises to 18%. The 941 non-Starbucks cases so far in FY ’23 exceed the total (840) for the first six months of FY ’20, which ended just as COVID-19 started to shut down the U.S. By contrast, the 798 non-Starbucks cases for the same period last year (FY ’22) did not. In other words, non-Starbucks RC cases in Oct.-Mar. FY ’22 were down 5% compared to the last corresponding pre-COVID period, but the Oct.-Mar. FY ’23 filings were up 12%.

1st Half FY RC Filings Non Starbucks 2018-2023


Starbucks RC Petitions

With 354 union election petitions involving Starbucks in FY ’22, it’s no surprise RC filings for the coffee retailer are down in the first half of FY ’23. There are fewer stores left to unionize. And the rare few that voted against the union are not yet susceptible to a new petition due to the NLRB’s “election bar” rule. Nonetheless, there still were 71 union election requests filed involving Starbucks between October 2022 and March 2023.

The following graph shows the total number of RC petitions filed in the first half of the corresponding NLRB fiscal years since FY 2018.

1st Half FY RC Filings All Employers 2018-2023

State-Specific Data

Looking at the data more locally, on a state-by-state basis, we see a few trends that may be instructive despite the relatively smaller sample sizes. As usual, California and New York have experienced the most union election requests in the first half of FY ’23. New Jersey and Pennsylvania have experienced a notable decline, while filings are up in Alabama, D.C., Massachusetts, North Carolina, Oregon, and Texas.

For this analysis, we’re excluding RC filings at Starbucks stores. As part of a nationwide employer-specific movement, we assume they’re less instructive of the general union activity in a particular geographic region. All statistics below are for the first half of the fiscal year (October through March) mentioned.

Alabama

Alabama sees very little union activity compared to most states. But the 8 union representation petitions filed so far in FY ’23 are double what the state usually sees in the first half of a fiscal year. There were 4 such filings in both 2020 and 2022, though there were also 8 in 2019.

California

RC filings in California have increased 43% from FY ’22 to FY ’23 and 54% compared to FY ’20.

D.C.

Though not a state, D.C. does have its own NLRB case data, and the numbers are up. Note the following first six months RC petition filing numbers for the respective fiscal years:

  • 2023: 32
  • 2022: 20
  • 2021: 15
  • 2020: 17
  • 2019: 11
  • 2018: 19

That’s a 60% increase from last year, which had been the high point in recent history.

Georgia

Though still modest overall, the level of union election petitions in Georgia has reached a new recent high as well:

  • 2023: 14
  • 2022: 8
  • 2021: 2
  • 2020: 7
  • 2019: 6
  • 2018: 8

Illinois

Illinois is among the more unionized states, but the FY ’23 numbers are higher than usual. The 71 RC petitions this year represents a 27% increase over 56 such cases in FY ’22 and a 13% increase over FY ’20.

Massachusetts

Another relatively union-prevalent state, Massachusetts has likewise experienced a recent increase in unionization activity. Its 44 union election requests in FY ’23 are a 175% increase compared to last year and up nearly 70% from its pre-COVID average.

New Jersey

Along with Pennsylvania, New Jersey is one of the few states that have seen fewer RC petitions in FY ’23. As shown below, these filings are down 15% versus last year and 58% compared to FY ’20. As with New York, we see a significant, and potentially lingering, COVID impact:

  • 2023: 22
  • 2022: 26
  • 2021: 19
  • 2020: 52
  • 2019: 47
  • 2018: 48

New York

New York’s FY ’23 filings are up 12% over last year, but still trail their pre-COVID FY ’20 level:

  • 2023: 106
  • 2022: 95
  • 2021: 84
  • 2020: 133
  • 2019: 86
  • 2018: 100

North Carolina

North Carolina slots in with Alabama and Georgia as southern states with traditionally low levels of union organizing activity. But it too has seen more RC cases filed in FY ’23:

  • 2023: 12
  • 2022: 4
  • 2021: 5
  • 2020: 9
  • 2019: 4
  • 2018: 4

Oregon

It may not be surprising that Oregon seems to be an increasingly pro-labor environment:

  • 2023: 38
  • 2022: 30
  • 2021: 16
  • 2020: 23
  • 2019: 18
  • 2018: 18

Pennsylvania

Pennsylvania shares a border and other potentially relevant conditions with New Jersey. Union election petitions are down similarly in both states. Here’s the Pennsylvania data:

  • 2023: 40
  • 2022: 57
  • 2021: 49
  • 2020: 59
  • 2019: 51
  • 2018: 29

Texas

Given its geographic size and growing (and already large) population, it may be particularly interesting to see that more than twice as many union election petitions (34) have been filed in the first half of FY ’23 compared to the previous year (16). That’s also a nearly 50% increase over pre-COVID levels:

  • 2023: 34
  • 2022: 16
  • 2021: 15
  • 2020: 23
  • 2019: 21
  • 2018: 25

Union Representation Election Results

Historically, unions win about 70% of the representation elections held. So far, they’ve won 78% of the 427 elections decided on petitions filed in FY ’23. Of course, that means nearly 700 of those cases have not yet resulted in an election being decided. Nearly 200 (~20%) have been withdrawn or dismissed. Almost 400 more cases are still pending.

With most representation cases filed in the first half of FY ’22 resolved, unions have won 75% of the elections completed, as they have in the aggregate for all elections in cases filed since the beginning of FY ’22 to date. The union has won a much higher percentage (83%) in Starbucks elections. But the non-Starbucks rate of 73% is still relatively high. And the Starbucks-adjusted union win rate for FY ’23 remains 78%.

It’s possible that the remaining open cases will shift the union win percentage down, But it’s also possible that unions are becoming increasingly successful in representation elections. Coupled with the growing number of election petitions filed, an increased union win rate warrants employers’ attention.


For more employment law updates, sign up for the Horton Law email newsletter and follow us on LinkedIn.

January 2023 NLRB Union Election

January 2023 NLRB Union Election Filings

In January 2023, NLRB union election filings continued their recent climb. But you must look beyond the raw numbers to see this reality. As has been the case for the past year, union organizing at Starbucks stores still complicates the analysis.

January 2023 Union Election Petitions

Overall, the National Labor Relations Board received 150 “RC” petitions seeking union representation in January 2023. While that is much lower than the 169 filed last January, the decrease is all attributable to the maturation of the Starbucks unionization campaign.

In January 2022, there were 35 petitions seeking elections involving Starbucks stores. This year that number has declined to only 7–an unsurprising result, given the volume of stores that already had elections last year.

Setting aside the Starbucks petitions, the 143 other union elections sought this January represent a 6% increase over the 134 non-Starbucks election petitions in January 2022.

With or without the Starbucks cases, the January 2023 RC filings nearly match the 149 petitions from January 2020 and significantly exceed the 114 January filings in both 2018 and 2019, as shown in the graph below.

Non-Starbucks NLRB Petitions Filed in January 2018-2023

FY 2023 to Date

The NLRB’s current fiscal year began on October 1, 2022. In the first four months of FY ’23, there were 582 union election petitions filed that didn’t involve Starbucks–a 13.5% increase from the same “post-COVID” period in FY ’22 and a nearly 5% increase from the same pre-COVID period in FY ’20.

Non-Starbucks NLRB Petitions Filed Oct-Jan FY 2018-2023

California and Texas Lead the Way

Most U.S. states see very few NLRB union election petitions filed in a single month. California and New York–large, relatively labor-friendly states–typically account for among the most RC petitions, as they did in January 2023. But it’s more notable that Texas continues to experience an upward trend in union elections.

California

With 15 non-Starbucks RC filings, California saw a 36% year-over-year increase from 11 petitions in January 2022. But 15 is well below the 23 January California RC petitions in 2020 and only back to the January average between 2018-2019.

Texas

Despite being the second-largest U.S. state by both land and population, Texas usually only sees a few RC petitions each month. Lately, that seems to be changing. Even excluding Starbucks, eight union election petitions were filed in Texas in January 2023. By comparison, only one RC petition was filed in the state in both January 2021 and January 2022, and 5 each in the month in 2019 and 2020.

With small sample sizes, it’s hard to reach dramatic conclusions about a potential trend toward increased union organizing in Texas. However, we can go back a little further for similar results. Between October and December 2022 (the first quarter of the NLRB’s 2023 fiscal year), 17 union election petitions (not involving Starbucks) were filed in Texas. Thus, there have been 25 such filings in the current NLRB fiscal year. During the same period in the previous fiscal years, there were only eight (FY ’22), nine (FY ’21), and 14 (FY ’20) union representation cases in Texas.

Georgia

Another southern state with an upward trend, Georgia had three non-Starbucks RC filings in January 2023. It had four total union election petitions filed in the previous five Januarys combined. There have now been 10 cases in Georgia this fiscal year, nearly as many as the 11 total union elections sought in Georgia between October and January over the previous three years.

Other Notable Gainers

Starbucks-adjusted January RC filings are also meaningfully up in:

  • D.C.: 6 in 2023 vs. 3 in 2022 and 6 total from 2018-2021
  • Illinois: 14 in 2023 vs. 11 in 2022 and no more than 9 between 2018-2021
  • Massachusetts: 6 in 2023 vs. 3 or 4 in each of the previous five years
  • Nevada: 7 in 2023 vs. 4 in 2022 and no more than 5 since 2018
  • North Carolina: 3 in 2023 vs. 3 total from 2018-2022
  • Washington: 9 in 2023 vs. 5 in 2022 and no more than 6 since 2018

Notably Down: New York & New Jersey

New York dropped from 16 to 12 January union election petitions compared to last year, matching the state’s five-year January low set in COVID-afflicted 2021.

New Jersey is another heavily unionized state that experienced a decrease in union election petitions in January 2023. Only five RC petitions were filed in the Garden State that month versus nine in both January 2022 and January 2020. (Like New York, New Jersey also experienced a large dropoff in such filings in January 2021 (only 1 case), presumably related to COVID-19 effects.)

FY 2023 Union Representation Election Results

Unions typically win about 70% of the representation elections held. Many petitions filed in Q1 FY 2023, including all of those filed in January, have not yet resulted in elections. Among those that have, unions have won about 76% of the time. Unions only won 71% of the elections held in cases filed in Q1 FY 2022. However, it may be too early to conclude that unions are winning elections more often since the data are incomplete.


To receive future updates and analysis on NLRB election statistics, sign up for our email newsletter.

Union Election Filings

Real Growth in Union Election Filings Entering 2023

The National Labor Relations Board began announcing an increase in union organizing activity in early 2022. More detailed analysis showed that those gains were primarily driven by elections at numerous Starbucks stores. Otherwise, the 2022 election statistics only suggested a return to pre-COVID levels. Now, however, statistics from the final three months of calendar year 2022, appear to reflect a general increase in union election filings entering 2023.

Starbucks Effect

Election petitions involving Starbucks stores accounted for an overwhelming proportion of the NLRB’s reported increase in union election filings in its fiscal year 2022 (from October 2021 through September 2022). For more, read Why Are Union Elections Increasing in 2022?

In NLRB FY 2022, there were 349 election petitions filed seeking union representation at Starbucks stores. To date, the union has won recognition in 223 cases and lost 48 times. Twenty-nine of the petitions have been withdrawn or dismissed for various reasons. Forty-nine of the cases remain open.

Excluding Starbucks cases, 1,345 union representation petitions were filed with the NLRB between January 1, 2022, and September 30, 2022. Though the numbers were much lower in 2020 and 2021 during the height of the COVID-19 pandemic, the same period in pre-COVID 2019 saw 1,329 union representation petitions filed. In other words, Starbucks-adjusted, there was only a 1% increase in 2022.

New Year Uptick

Entering 2023, continued increases in union representation elections seem to exceed any direct Starbucks or COVID impact.

Over the second half of NLRB FY 2022 (April-September), non-Starbucks union election petitions (922) were actually below the total for the same period in 2019 (943). The fourth quarter of FY 2022 (July-September) saw only a minimal increase from 453 to 464 compared to 2019.

Then, from October 1 through December 31, 2022, there were 437 union election petitions filed that didn’t involve Starbucks. That represents a 16% increase from the same “post-COVID” period in 2021 and a nearly 8% increase from the same pre-COVID period in 2019.

Oct. - Dec. Non-Starbucks Union Representation Petitions Filed

Note that Starbucks employees are still seeking representation at new stores. Thirty-six union representation petitions were filed between October and December 2022. Only 11 were filed during those months the previous year, when the Starbucks organizing campaign had just begun. But the Starbucks monthly filing rate has decreased to about a third of what it was in NLRB FY 2022.

Where Are Union Elections Becoming More Likely?

A few states substantially account for the recent increase in Starbucks-adjusted union representation petition filings. Due to differences in population and other factors, such as historical union activity, the typical number of petitions varies considerably between states. Thus, a proportional increase in filings in a given state will have a greater or lesser impact on the total number of election petitions filed nationwide.

First, let’s look at the total number of union representation petitions filed between October and December over the past few years in several notable states. These are listed in the chart below.

Union Election Petitions
Filed Oct.-Dec.
2019202020212022
California52514774
DC9101315
Georgia5037
Massachusetts188424
New York67404254
Tennessee1125
Texas98717

Not surprisingly, California had the most petitions between October and December 2022. Conversely, Southern states Georgia and Tennessee had only about a handful. And Texas had relatively few compared to its overall population. However, these states had proportionally more union representation petitions filed in Oct.-Dec. 2022 than over the same months in the recent past.

Here are the ranked percentage increases in union election filings for these states for Q1 of the NLRB fiscal years 2022 and 2023:

  • Massachusetts: 500%
  • Tennessee: 150%
  • Texas: 143%
  • Georgia: 133%
  • California: 57%
  • New York: 29%
  • DC: 15%

And here are the percentage increases between the first quarters of the NLRB fiscal years 2023 and 2020 (the last fully pre-COVID quarter):

  • Tennessee: 400%
  • Texas: 89%
  • DC: 67%
  • California: 42%
  • Georgia: 40%
  • Massachusetts: 33%
  • New York: -19%

Large Labor-Friendly States: A Closer Look

New York

Yes, to be clear, total union representation petitions filed in New York remain below pre-COVID levels. But they are up over last year. Frankly, New York probably wouldn’t be worth mentioning here, except that it normally accounts for a significant portion of the union elections filed with the NLRB. So a modest increase from Q1 FY 2022 to Q1 FY 2023 has a material impact on the total nationwide increase. As previously discussed, it is plausible that union organizing in New York is still recovering from COVID-19 at a slower rate than the rest of the country.

In fact, we can dig deeper and learn that non-Starbucks petitions are essentially flat throughout most of New York State. All of the year-over-year increase comes from Region 29 of the NLRB. Region 29 is based in Brooklyn and covers Brooklyn, Queens, Staten Island, and Long Island. NLRB Q1 union representation petitions not involving Starbucks increased from 7 in FY 2022 to 19 in FY 2023. But that number still falls well below the 33 such filings in Oct. through Dec. 2019 (Q1 FY 2020). Meanwhile, Manhattan and Upstate New York filings have remained surprisingly consistent, with hardly any deviation among the first quarters of fiscal years 2020, 2022, and 2023.

California

Similarly, California’s increase is localized to two of the four NLRB regions covering the state: Region 20, based in San Francisco, serving the northernmost part of the state, and Region 21, based in Los Angeles and San Diego, serving the southernmost part.

California union representation petitions increased from 10 in Q1 FY 2022 to 21 in Q1 FY 2023 in Region 20 and from 12 to 21 in Region 21. The Q1 FY 2020 filings were 9 for Region 20 and 14 for Region 21, showing more than just a return to pre-COVID levels. While the central California Regions (31 and 32) increased slightly between Q1 FY 2022 and 2023, both Regions are still roughly even with Q1 FY 2020 petitions.

Decertification Petitions

The corollary to an NLRB petition seeking union representation (known as an “RC” petition) is a decertification (“RD”) petition seeking the removal of a previously recognized union representative. An earlier analysis of RD petitions for the first half of FY 2022 supported the conclusion that last year’s increase in RC filings (not involving Starbucks) may have been a COVID-related phenomenon. A 42% year-over-year increase in RD petitions over that period was actually higher than the Starbucks-excluded increase among RC petitions (36%).

Decertification petition filings remained at or above pre-COVID levels throughout FY 2022. However, it appears that trend may be dissipating. Seventy RD petitions were filed with the NLRB between October and December 2022–virtually the same as the 71 filed in the same period in 2021. While still higher than the 56 filed in October-December 2019, the RD petitions filed in Q1 FY 2023 remain below the levels for the same period of 2017 (82) and 2018 (76).

Representation Election Results

Unions typically win about 70% of the representation elections held. Many petitions filed in Q1 FY 2023 have not yet resulted in elections. Among those that have, unions have won about 75% of the time. But with so many cases yet to be decided, we don’t know whether unions are really becoming more likely to win representation status.

What Does the Recent Increase in Union Elections Means for Employers in 2023?

It’s really still too early to tell. But the latest statistics start to suggest a measurable shift toward greater unionization at private sector companies in the United States. Certain Southern states might be experiencing a particular renewed interest in union activity. Georgia, Tennessee, and Texas might constitute a current “watch list.” Areas with an existing higher propensity toward unionization, like parts of California, New York, and Massachusetts, may also be undergoing renewed employee interest in organizing.

Employers should continue to monitor these data, especially if they have any reason to suspect union organizing in their workplace.


To receive future updates and analysis on NLRB election statistics, sign up for our email newsletter.